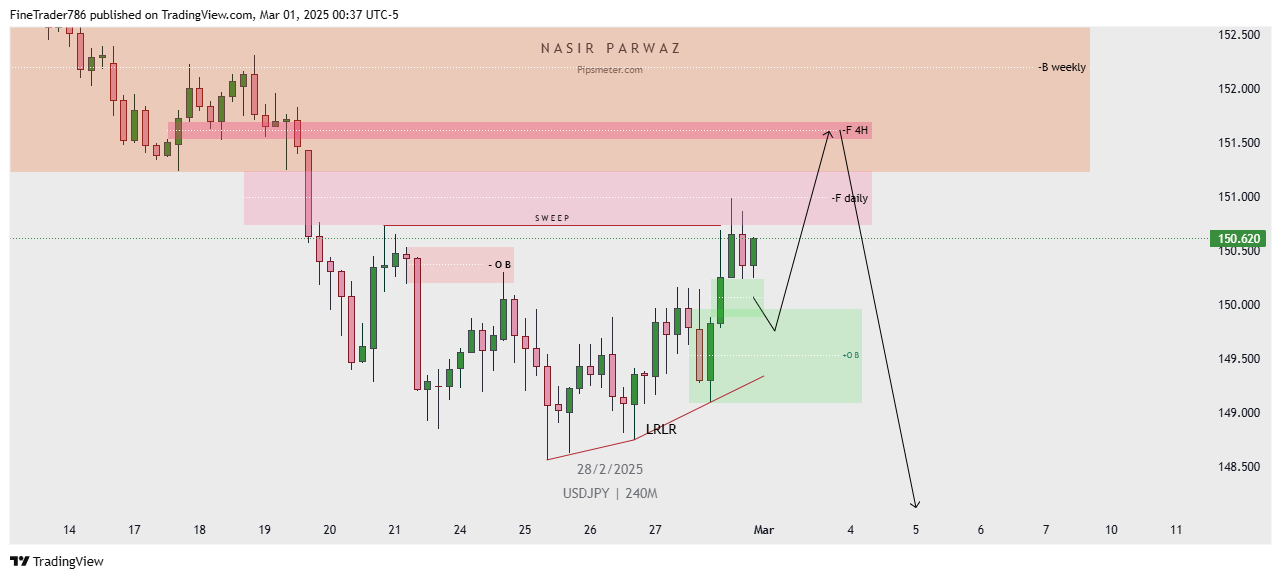
This chart is a 4-hour (240-minute) price analysis of the USD/JPY currency pair, published on TradingView. It incorporates technical analysis concepts such as supply and demand zones, order blocks (OB), and liquidity sweeps.
Key Observations:
- Supply Zones:
- A weekly bearish order block (B weekly) is marked in a large orange zone around 151.500 – 152.500.
- A 4-hour bearish order block (F 4H) is marked within this zone, signaling potential resistance.
- Demand Zones:
- A bullish order block (OB) is identified in green around 149.500 – 150.000, suggesting a support zone.
- Liquidity & Market Structure:
- SWEEP is marked, indicating a liquidity grab before price movement.
- LRLR (Lower-Right-Lower-Right) suggests a bullish short-term structure.
- Price is projected to move up towards the 4H order block (F 4H) before a sharp downward move.
- Projected Price Movement:
- Price is expected to first rise into the 151.500 zone, where it might face resistance.
- A strong bearish rejection is anticipated, leading to a decline towards sub-149.500 levels.
This chart suggests a short-term bullish move followed by a significant bearish reversal, aligning with smart money concepts like liquidity grabs and institutional order flow.
Waqar Nawab
March 1, 2025Good job bro keep it up