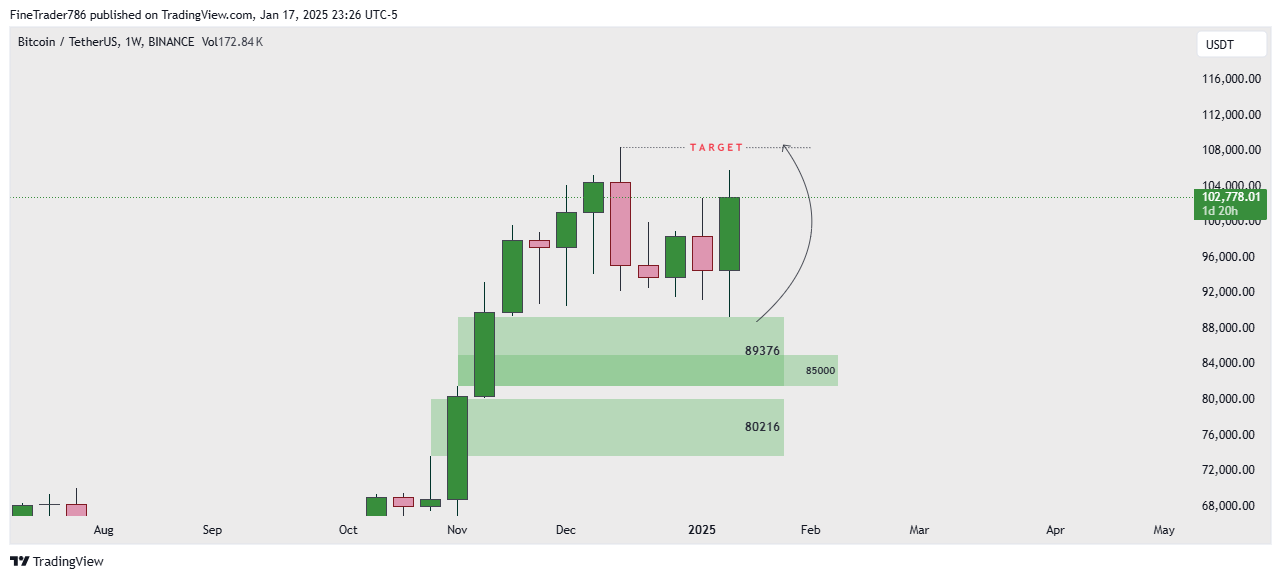
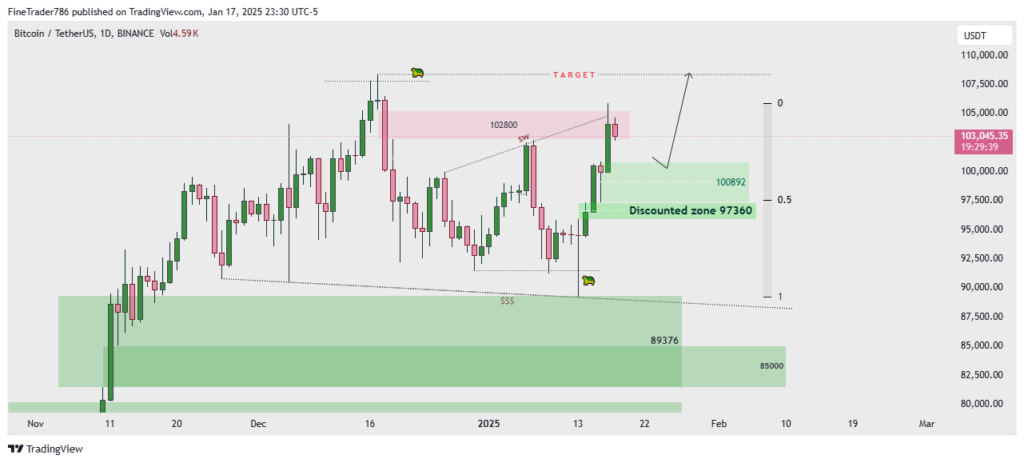
If we see weekly chart of Bitcoin we see that we are IRL to ERL which is bullish move from weekly FVG to ALL time high. And if we see daily chart of Bitcoin then we have a rejection from Bearish FVG 102800. Now I am Expecting a bullish Buy move from 100892 area.
Copy my drawing to your chart https://www.tradingview.com/x/PiZ9slTM/
See Forex charts here
Fuzail
January 18, 2025Very well briefly explain. Thank you
admin
January 18, 2025If you need any other coin analysis, ask me here