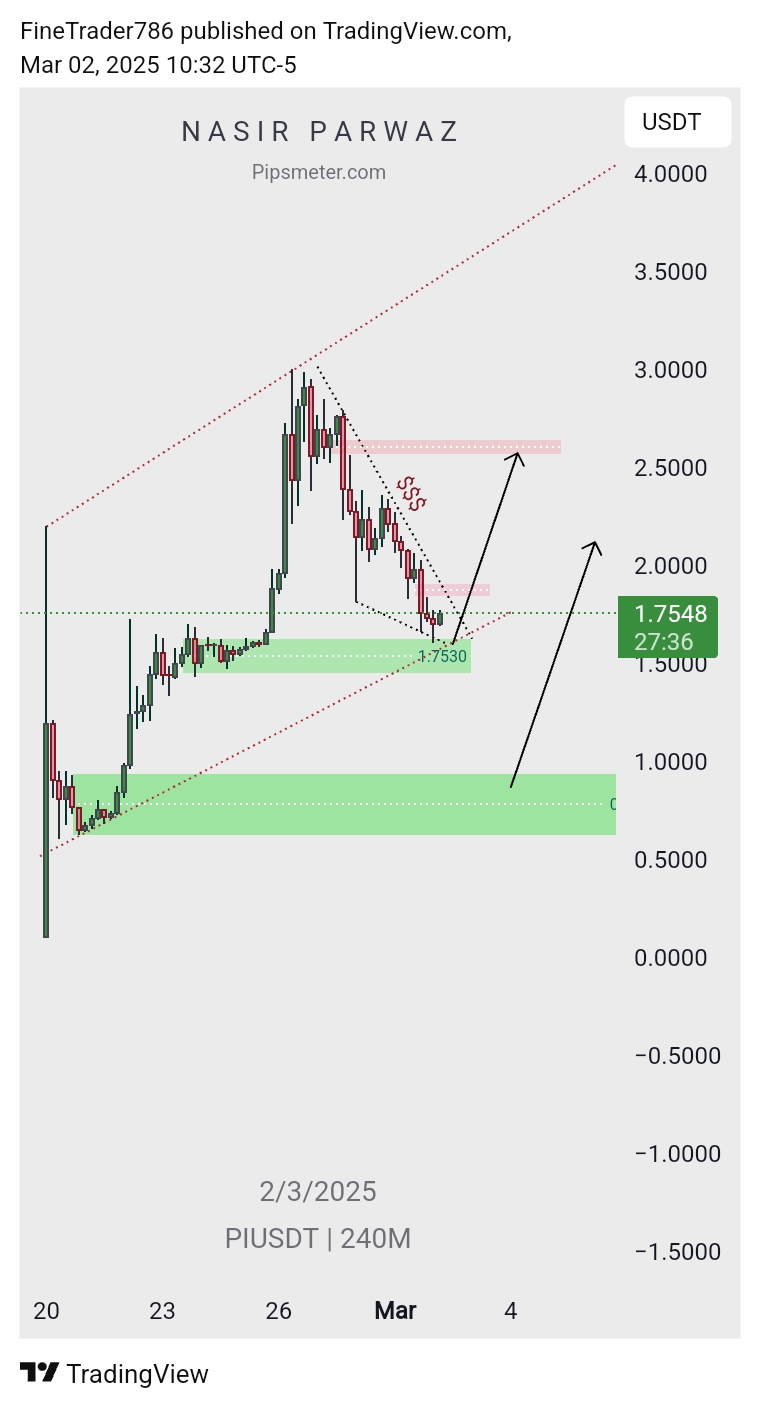
Pi Token chart analysis 2 March 2025
This chart is a technical analysis of the PI/USDT trading pair on a 240-minute (4-hour) timeframe, published on TradingView by FineTrader786. The analysis shows a descending price movement forming a wedge-like pattern, followed by a potential reversal from the green support zone around 1.7530 USDT. Key observations: The analysis suggests a potential bullish breakout if…
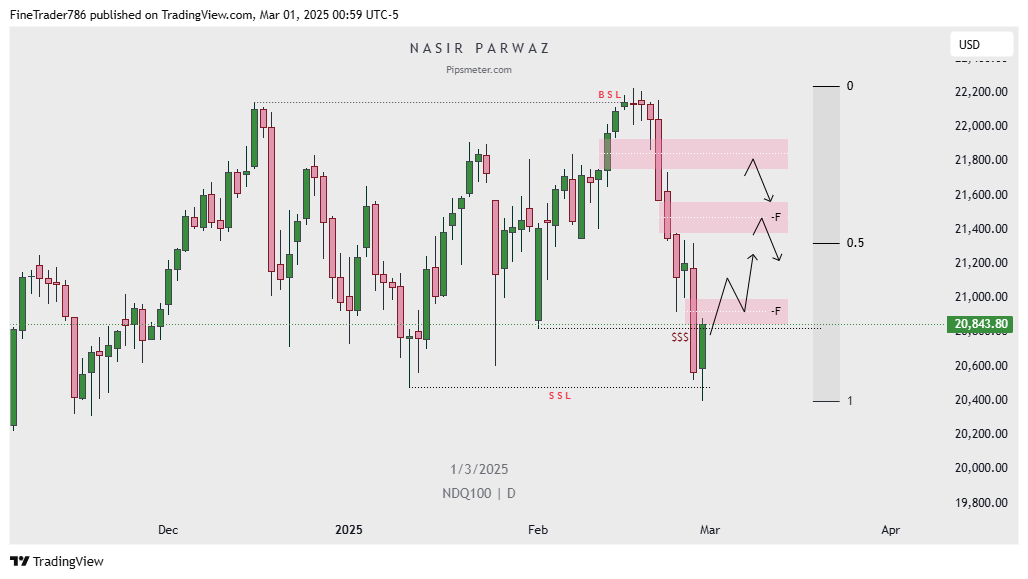
NASDAQ weekly GAMEPLAN 2 March 2025
This is a daily chart of the NDQ100 (Nasdaq 100) index, published on TradingView, using smart money concepts like liquidity sweeps, order blocks, and Fibonacci retracement levels. Key Observations: Conclusion: The market appears to be in a bearish correction phase, where a short-term bounce is likely before further declines. Traders might look for short positions…
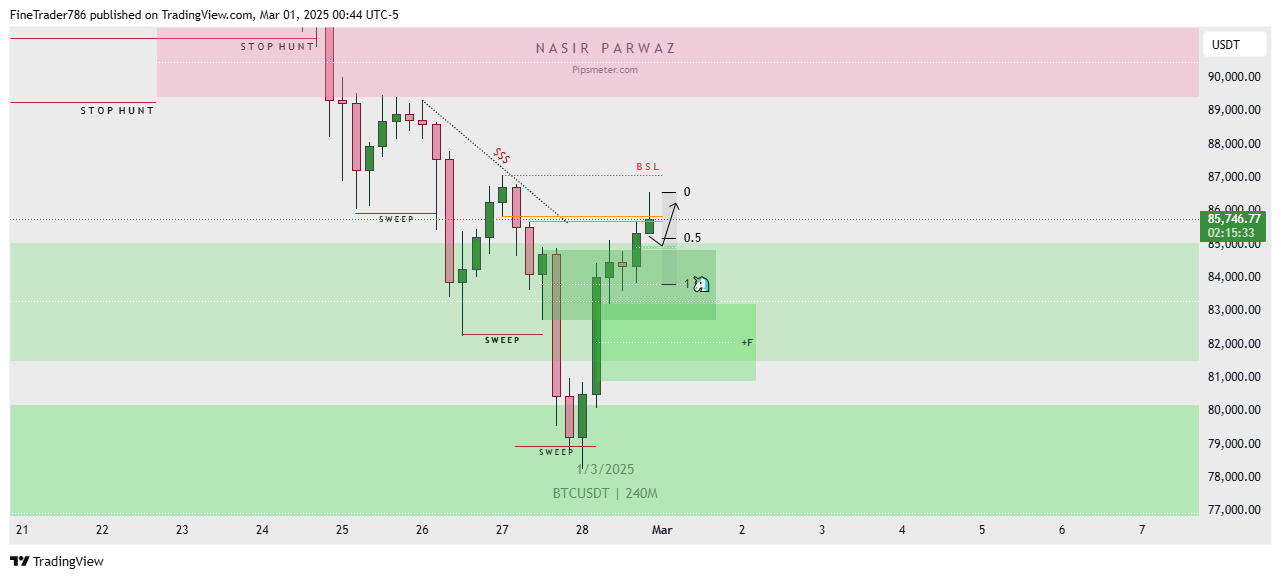
Bitcoin Technical Analysis 2 March 2025
This chart is a 4-hour (240-minute) analysis of BTC/USDT published on TradingView, applying smart money concepts such as liquidity sweeps, stop hunts, and support/resistance levels. Key Observations: Conclusion: This chart suggests a bullish market structure shift, with price targeting higher liquidity zones after breaking key resistance. A minor pullback may occur before further upside, with…
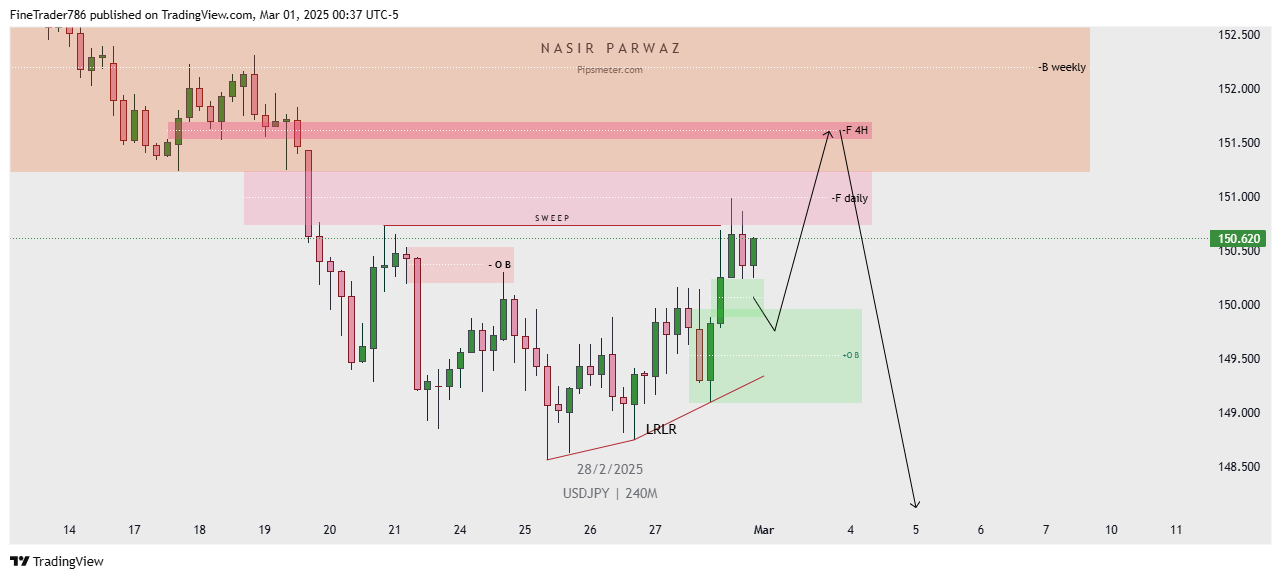
USDJPY Technical analysis 2 March 2025
This chart is a 4-hour (240-minute) price analysis of the USD/JPY currency pair, published on TradingView. It incorporates technical analysis concepts such as supply and demand zones, order blocks (OB), and liquidity sweeps. Key Observations: This chart suggests a short-term bullish move followed by a significant bearish reversal, aligning with smart money concepts like liquidity…
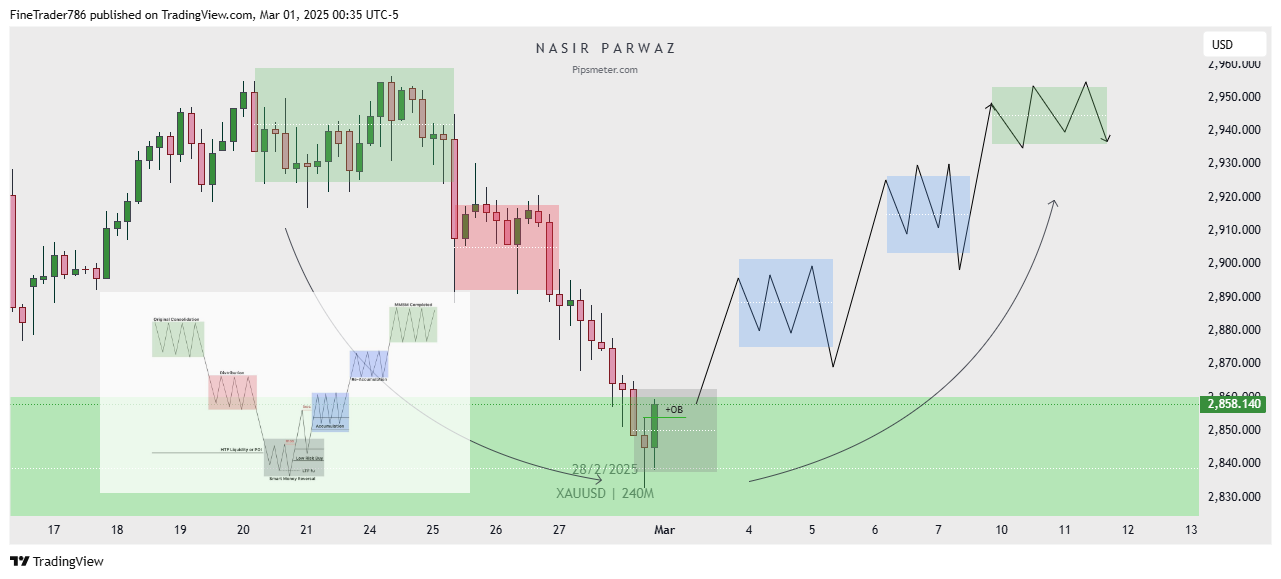
XAUUSD technical analysis 2 March 2025
As of March 1, 2025, gold prices have experienced significant volatility, influenced by various economic factors and geopolitical events. The XAU/USD pair reached an all-time high of $2,956 on Monday but has since corrected, trading at approximately $2,864.33 per ounce, marking a 2.5% decline for the week. Reuters Key Influencing Factors: Technical Analysis: Technical indicators…
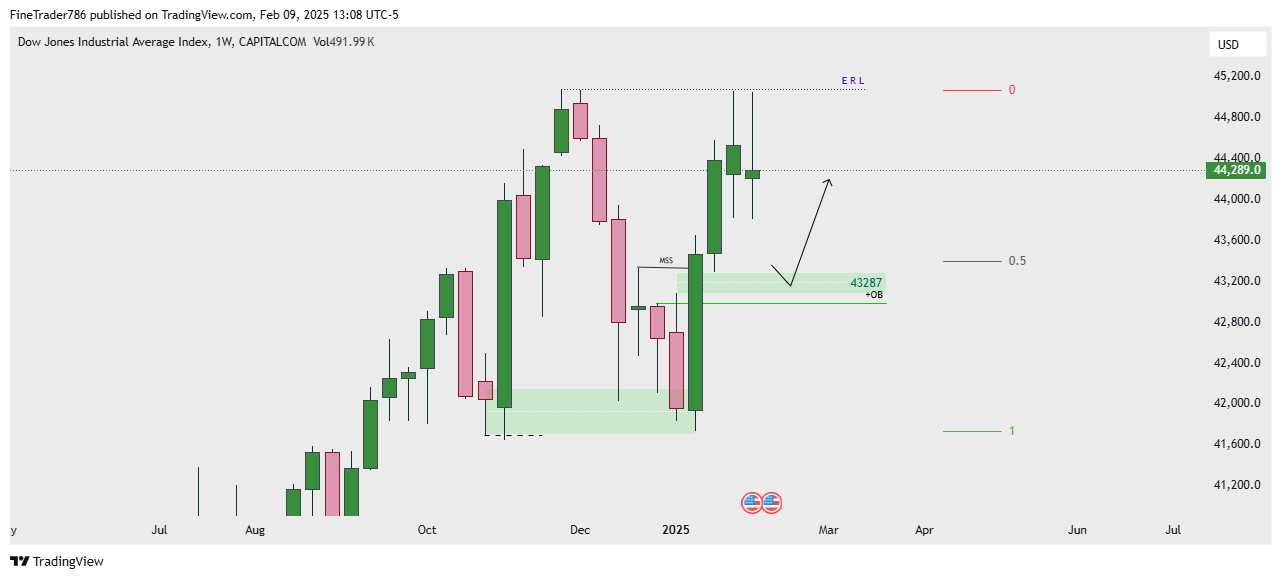
US30 chart Technicals 09 Feb 2025
This chart represents the Dow Jones Industrial Average Index (US30) on the Weekly (1W) timeframe, showing a technical analysis outlook. Key Observations: Projected Price Movement:
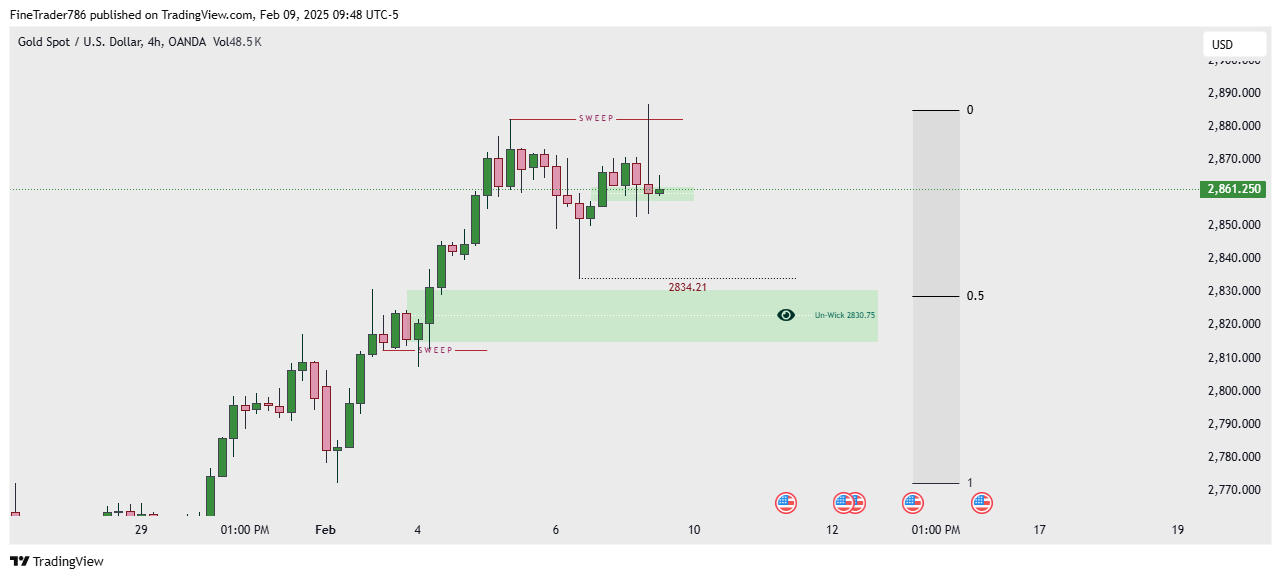
Gold Weekly Game Plan
In the gold market, I anticipate a bearish move continuing until $2,830.75. At this level, the price is expected to react to an unmitigated Order Block (OB) on the 4-hour timeframe, leading to a potential bullish reversal. This suggests that once the price reaches the identified OB, buying pressure may emerge, driving the market upward.
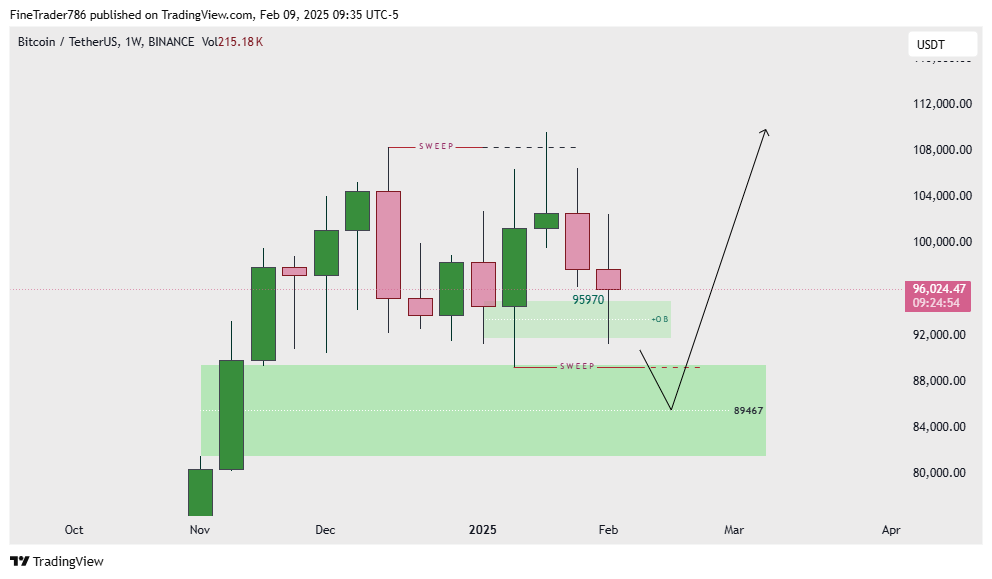
Bitcoin Market Update 09 Feb 2025
Based on your expectation, Bitcoin is likely to see a bullish move starting from 89,467, with 89,602 being swept out before the uptrend. This suggests a liquidity grab at 89,602, where stop-loss orders or short positions might be triggered before the price reverses upward. Scenario Breakdown:
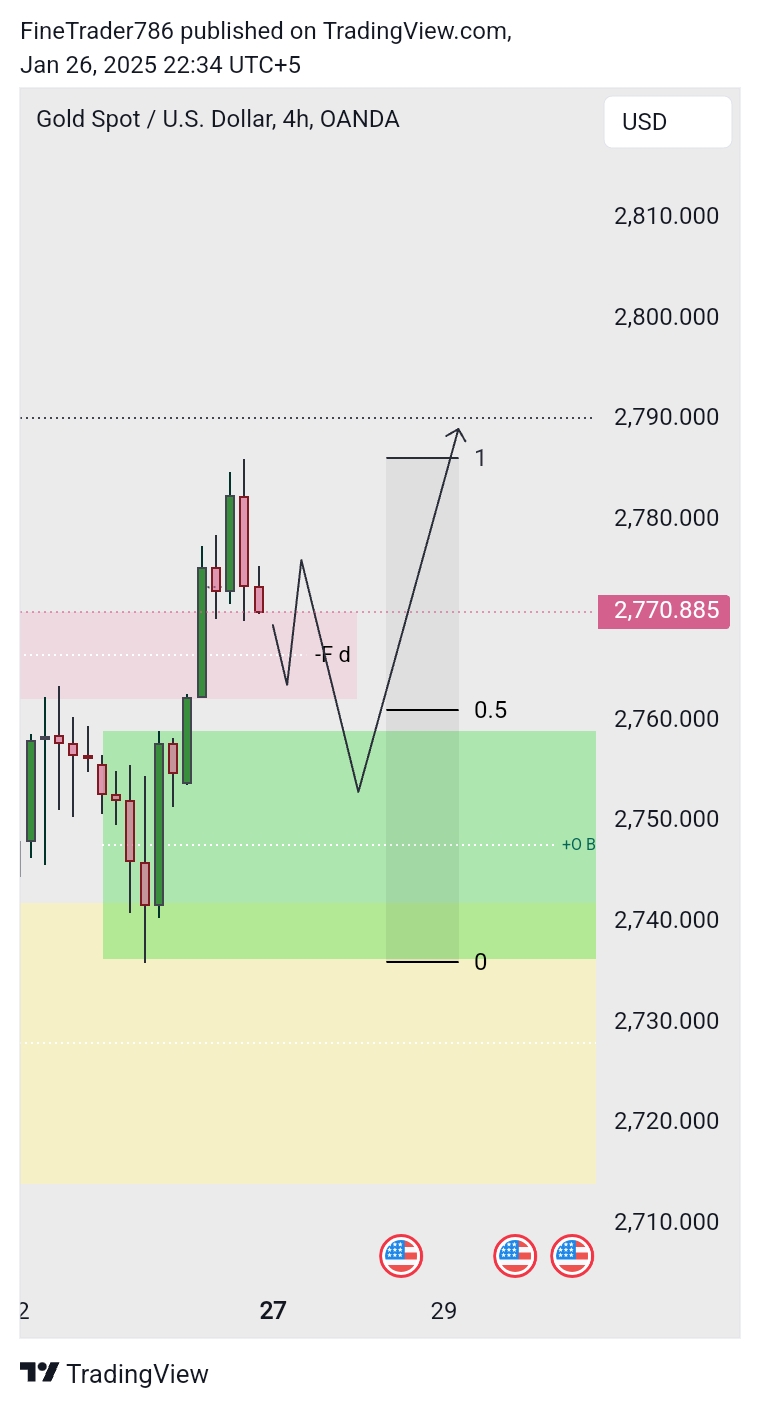
XAUUSD (GOLD) Weekly Update 26 Jan 2025
Gold ia going super Bullish and the only thing which give it a daily FVG for sell and previous daily candle is closed inside the FVG. But it can be a trap. We will take buy entry inside Bullish POI
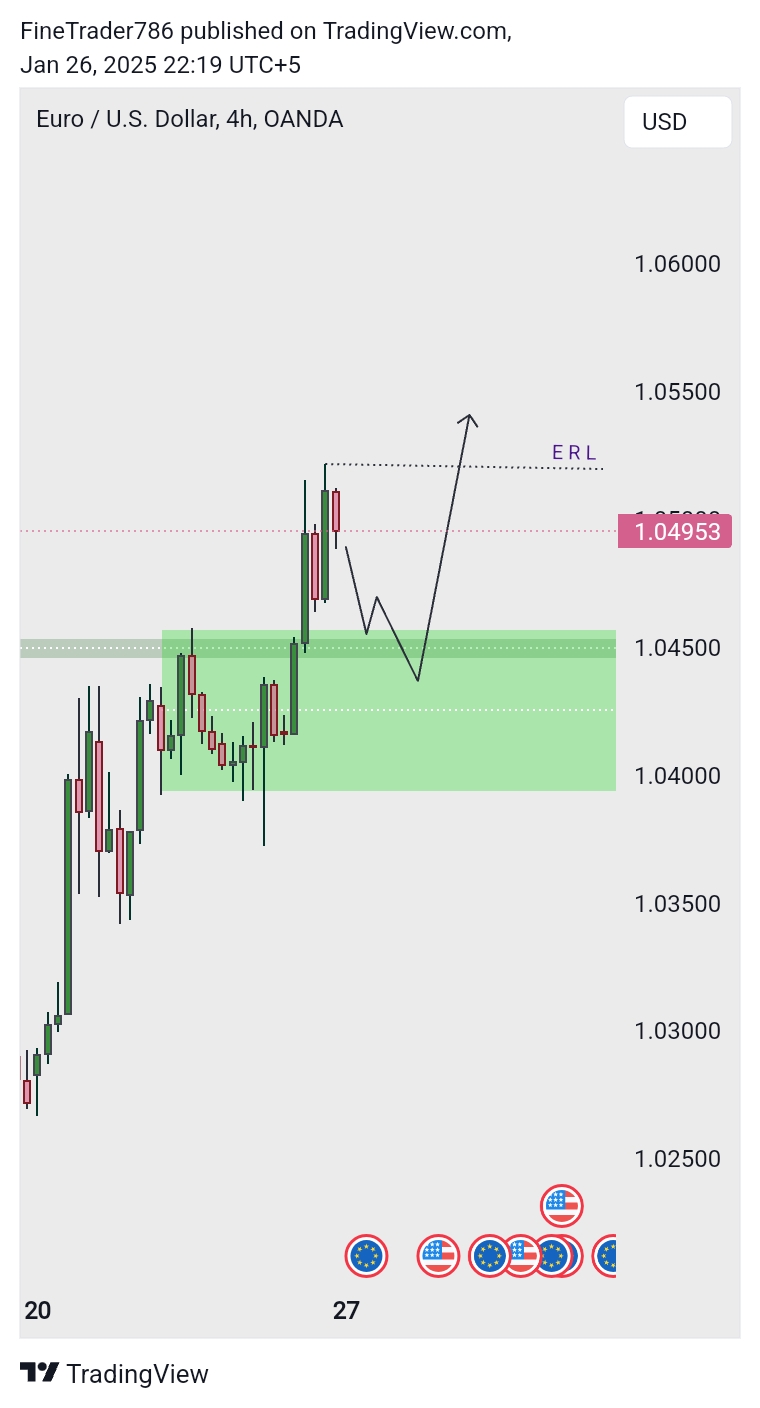
EUR USD Update 26 Jan 2025
Euro USD is also looking Bullish. If we see EURUSD in weeky then price recently created a bullish IFVG which is also aligned with a 4H OB. Now we will wait for the price to touch the POI inside Time frame then we will wait for a clear confirmation in m15.