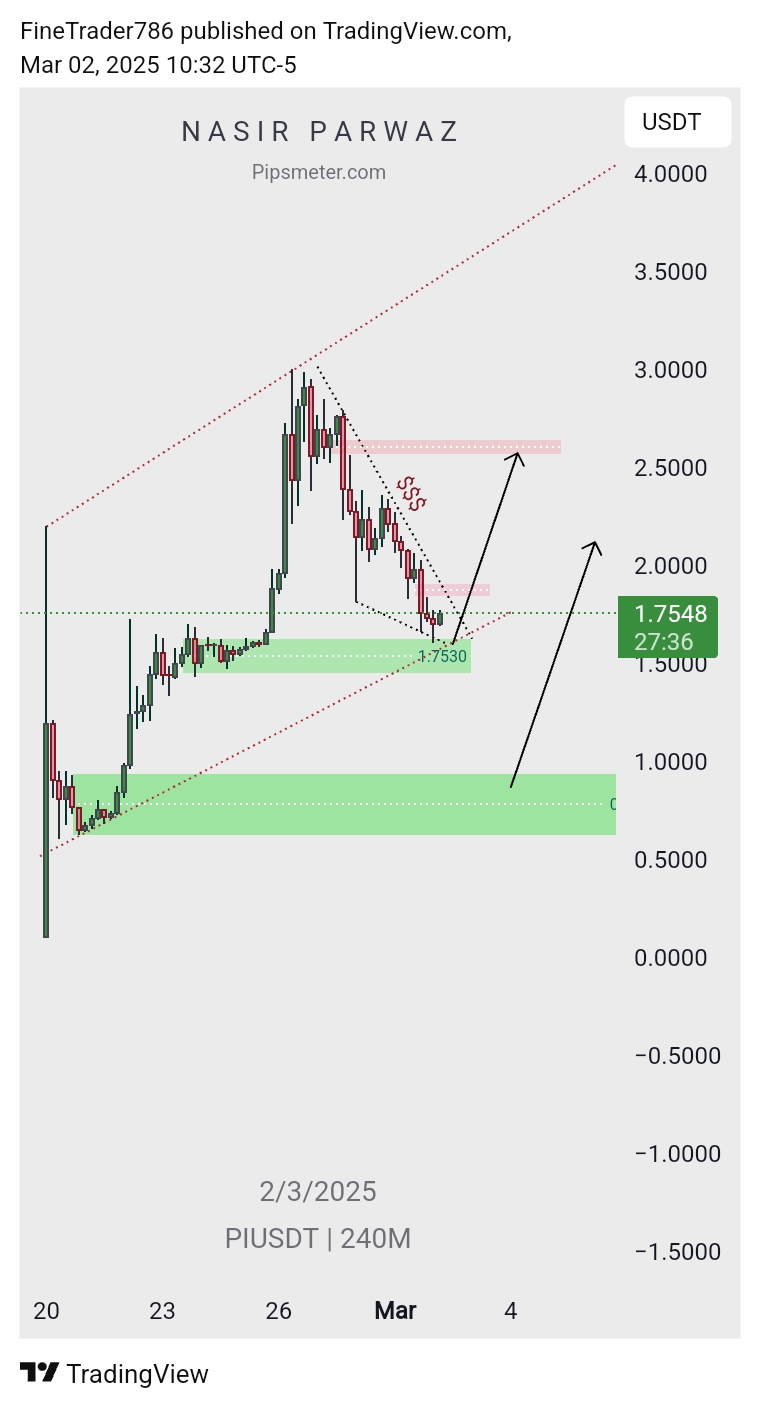
This chart is a technical analysis of the PI/USDT trading pair on a 240-minute (4-hour) timeframe, published on TradingView by FineTrader786. The analysis shows a descending price movement forming a wedge-like pattern, followed by a potential reversal from the green support zone around 1.7530 USDT.
Key observations:
- The price has been in a downtrend but is testing a strong support zone.
- The green highlighted area indicates a demand/support zone where buying interest may emerge.
- Two possible upward price movement scenarios are suggested with arrows. One targets the red resistance area around 2.5 USDT, while another aims for a higher rally.
- The red zone marked with “$$$” indicates a potential sell or supply area where the price might face resistance.
The analysis suggests a potential bullish breakout if the support holds, but traders should watch price action for confirmation.