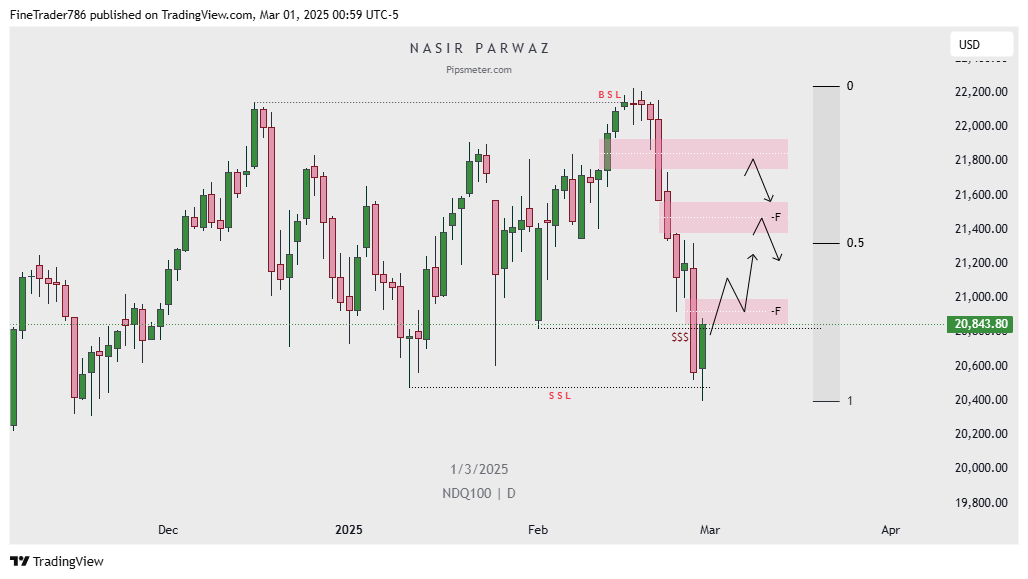
This is a daily chart of the NDQ100 (Nasdaq 100) index, published on TradingView, using smart money concepts like liquidity sweeps, order blocks, and Fibonacci retracement levels.
Key Observations:
- Liquidity & Market Structure:
- BSL (Buy-Side Liquidity) was taken near 22,000, indicating a previous stop hunt.
- SSL (Sell-Side Liquidity) was taken below 20,600, suggesting a liquidity grab before reversal.
- SSS (Strong Support Structure) is marked at a recent low.
- Potential Retracement & Resistance Zones:
- The chart marks three resistance zones (F zones), suggesting price may pull back into these areas before continuing its trend.
- These zones align with a 0.5 Fibonacci retracement, a key level in technical analysis.
- Projected Price Action:
- Price may retrace to around 21,200 – 21,600 before facing resistance.
- A rejection from these resistance zones could lead to further downside.
- A minor bullish push is expected before continuation.
Conclusion:
The market appears to be in a bearish correction phase, where a short-term bounce is likely before further declines. Traders might look for short positions near the marked F zones if rejection signals appear.