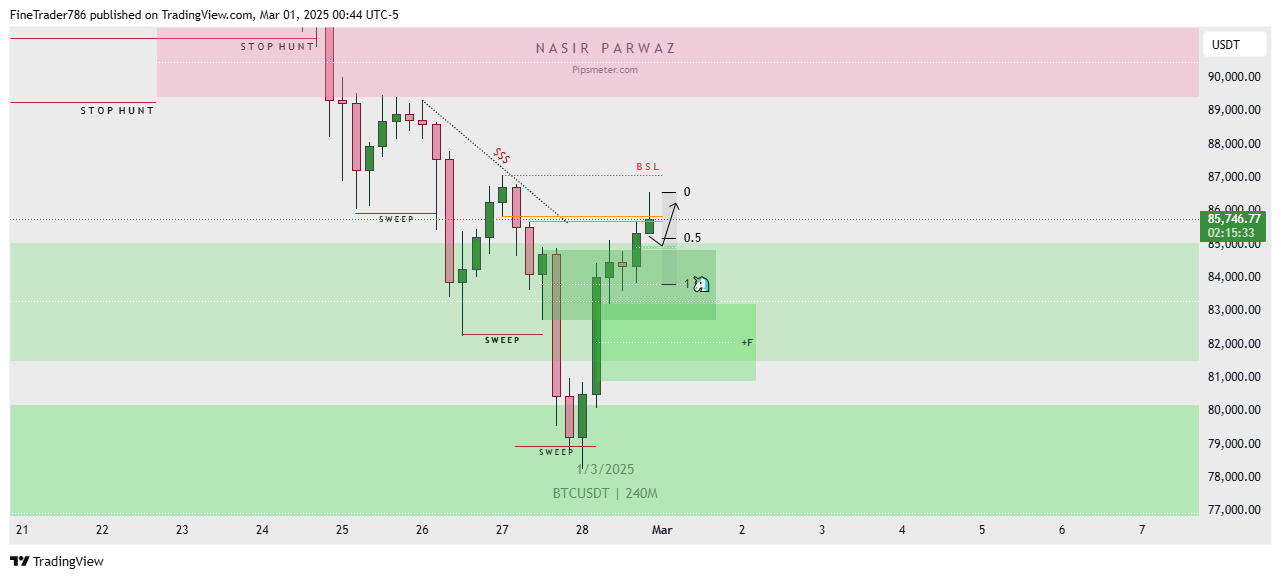
This chart is a 4-hour (240-minute) analysis of BTC/USDT published on TradingView, applying smart money concepts such as liquidity sweeps, stop hunts, and support/resistance levels.
Key Observations:
- Liquidity & Stop Hunts:
- A “Stop Hunt” zone is highlighted in red around 89,000 – 90,000, indicating a previous liquidity grab.
- Sweeps have occurred at both local highs and lows, suggesting price manipulation before trend continuation.
- Market Structure & Key Levels:
- A descending trendline (SSS – Strong Supply Structure) was broken.
- BSL (Buy-Side Liquidity) is marked near 85,800, where stops might be resting.
- A 0.5 retracement level is noted, indicating a potential short-term pullback before continuation.
- Demand Zones & Future Price Action:
- A bullish demand zone (F) is marked in green around 79,000 – 81,000, acting as strong support.
- Price has recently bounced from a lower sweep zone and is currently in an uptrend.
- Projection: Possible short-term retracement to the 0.5 level before further bullish continuation.
Conclusion:
This chart suggests a bullish market structure shift, with price targeting higher liquidity zones after breaking key resistance. A minor pullback may occur before further upside, with 90,000+ levels as a potential long-term target.