This chart represents the Dow Jones Industrial Average Index (US30) on the Weekly (1W) timeframe, showing a technical analysis outlook.
Key Observations:
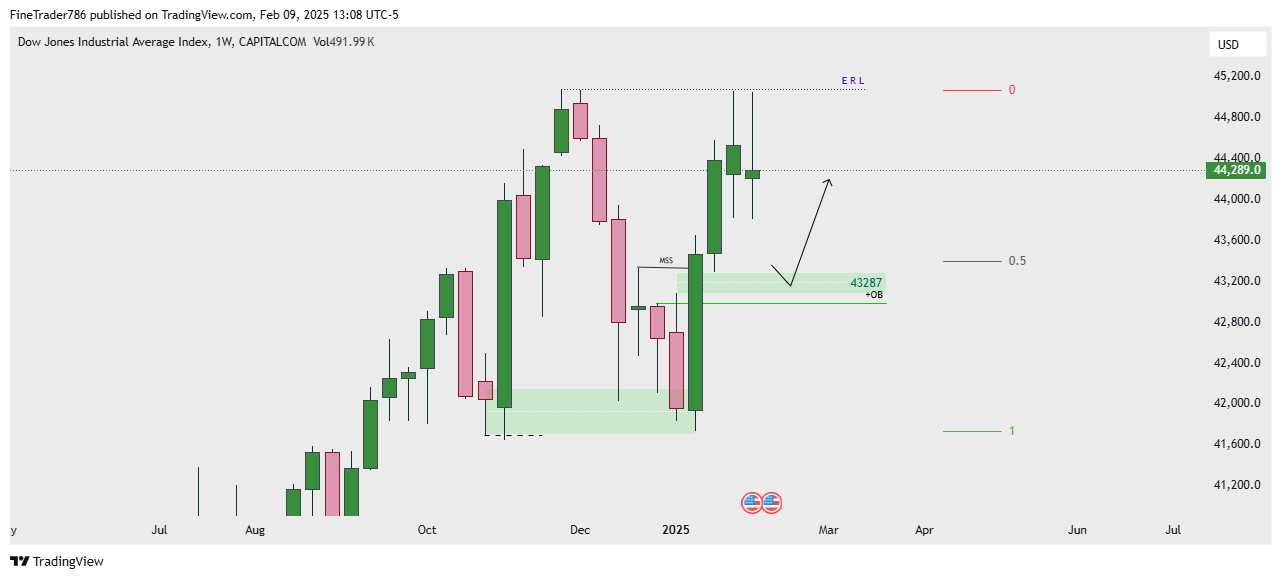
- Order Block (OB) & Expected Retracement:
- A bullish Order Block (OB) is marked around the 43,200 level, suggesting a potential area of demand where price could react.
- Price is expected to pull back into this OB before continuing its upward move.
- Market Structure Shift (MSS):
- A Market Structure Shift (MSS) is identified, indicating a potential trend reversal or continuation setup.
- This shift confirms a bullish bias once price mitigates the OB.
- Liquidity & Key Levels:
- Equal Range Liquidity (ERL) is marked at the highs, possibly serving as a liquidity target.
- The 0.5 Fibonacci retracement level aligns with the OB, strengthening its validity as a buy zone.
Projected Price Movement:
- The chart suggests that price may decline into the OB zone around 43,200 before resuming an uptrend toward liquidity levels above 44,800 – 45,200.
- Confirmation of a bullish move may come from price action signals within the OB zone.
Tabish
February 9, 2025Ma sha Allah ❤️